
Content – Abstract | Introduction | Methodology | Results & Discussion | Conclusions & Recommondations
ABSTRACT
With the increase of global warming, carbon sequestration has become a major area of interest at present. Sustainable development goals (SDG) 12 (Responsible consumption and production), 13 (Climate action), and 15 (Life on land) are aligned with carbon sequestration. The Central Province of Sri Lanka has been identified as a critical carbon sink. Lack of proper identification of the carbon sequestration hotspots and cold spots in the Central Province is a drawback for the precise conservation of hotspots and restoration of cold spots. This study aims at precisely mapping carbon sequestration hotspots and cold spots in the Central Province using remote sensing, and geographical information systems. The carbon sequestration hotspot map was developed using seven parameters which include soil organic carbon content, normalized difference vegetation index, land use and land cover, land surface temperature, soil pH, slope, and mean annual rainfall. Soil organic carbon content, which has a 36% impact level, was the most influential parameter on carbon sequestration potential, whereas the mean annual rainfall, with a 2% importance level, has the least impact. Horton Plains and the forest reserves in the Nuwara Eliya district serve as the most significant sequestration hotspots. Urbanized areas in Kandy, Matale, Dambulla, and Wasgamuwa National park are identified as the significant sequestration cold spots. The developed carbon sequestration potential map has a correlation coefficient (R2 value) of 0.76 with the soil carbon sequestration map of the Food and Agriculture Organization.
Keywords: SDG, Carbon sequestration, Hotspots, Cold spots, Correlation
1 INTRODUCTION
1.1 Background of the study
Carbon Dioxide (CO2) has gained considerable attention in recent years as a greenhouse gas which plays a major role in increasing global temperature. Anthropogenic activities have contributed to this increase prominently, but nature has its ways of compensating for increased atmospheric CO2 concentrations by sequestering and storing it in various types of reservoirs (Abeysekara et al., 2019).
Carbon sequestration is the process of capturing and storing atmospheric carbon dioxide (CO₂) to reduce its concentration in the atmosphere and mitigate global warming (Sierra et al., 2021) which is aligned with several key Sustainable Development Goals (SDGs), notably SDG 12 (Sustainable consumption and production), SDG 13 (Climate Action), SDG 15 (Life on Land), and SDG 7 (Affordable and Clean Energy).
The Central Province of Sri Lanka is the selected study area and it is characterized by its unique geography (mountainous terrain with elevations ranging from 300 m to over 2,500 m), climate, and biodiversity. The Province has been subjected to continuous development. The climate of the Central Province varies significantly depending on the elevation. Highlands experience a comparatively cooler climate demarcated with higher rainfall. Lower elevations are characterized by varying rainfall patterns and tropical warm climates. Biodiversity is enriched with montane forests, wetlands, and grasslands. This uniqueness has made it a significant area of ecological studies and conservation (Sarathchandra et al., 2021).
Even though, the Central Province is ecologically important it faces several threats from environmental degradation, land use change and deforestation due to development (Sarathchandra et al., 2021).
Locating carbon sequestration hotspots in rapidly developing regions where land use changes occurred by deforestation for agriculture and urban development significantly reducing area’s ability to sequester carbon is crucial for environmental and socio-economic stability, Additionally, the climate change has affected the region by changing rainfall patterns and temperature patterns (Ramachandra & Bharath, 2020).
Geographical Information Systems (GIS) and Remote Sensing (RS) can be used as innovative tools for environmental protection and monitoring, with the use of detailed satellite and aerial imagery and advanced data processing methods (Droj, 2012).
1.2 Problem statement
Deforestation, land use changes, and environmental changes have imposed significant threats for environmental sustainability in the Central Province. Several key factors that drive this vulnerability have been identified. Agricultural expansion is a prominent cause of deforestation due to the demand for farmland, especially for tea and rubber. Rapid urbanization has been identified as another issue. Urban development and infrastructure projects cause habitat loss and fragmentation. Unsustainable logging practices are also exacerbating deforestation, further endangering biodiversity in the region. The Central Province holds a significant potential as a critical carbon sink due to its diverse ecosystems. The montane forests and other vegetation types in the area play a vital role in carbon sequestration, helping to mitigate climate change. The dense forests can absorb substantial amounts of carbon dioxide from the atmosphere, making them essential for global carbon management strategies. However, climate change is affecting the region by altering rainfall and temperature patterns, disrupting the delicate balance of local ecosystems (Sarathchandra et al., 2021).
GIS and RS offer precise, up-to-date data critical for informed decision-making and disaster response by environmental monitoring and protection (Droj, 2012). By examining how land use has changed and how different vegetation types store carbon, these tools can pinpoint areas that are most effective in capturing carbon from the atmosphere, guiding conservation and land management efforts (Khosravi et al., 2015).
The Central Province holds significant potential as a critical carbon sink due to its diverse ecosystems. The montane forests and other vegetation types in the region play a vital role in carbon sequestration, helping to mitigate climate change. The dense forests can absorb substantial amounts of carbon dioxide from the atmosphere, making them essential for global carbon management strategies (Sarathchandra et al., 2021). There is very limited research conducted on this issue covering the Central Province of Sri Lanka. Therefore, this research is aimed at identifying carbon-rich areas in the Central Province of Sri Lanka using more precise methods like GIS and RS which are more reliable than traditional methods, leading to conservation or restoration. This helps to utilize the significant potential of the region as a carbon sink. Critical insights will be provided to policymakers, environmental managers, and other stakeholders to combat global warming in the Central Province of Sri Lanka through sequestering carbon.
1.1 Objectives
1.1.1 Main objective
The main objective of this research is to identify, and map carbon sequestration hotspots in Central Province, Sri Lanka to support sustainable environmental management and climate change mitigation strategies.
1.1.2 Specific Objectives
- To develop a spatial map of carbon sequestration potential by combining multiple variables.
- To identify areas with the lowest carbon sequestration potential, that need to apply required management practices.
2 METHODOLOGY
2.1 Research materials and methods
A carbon sequestration hotspot map of the Central Province of Sri Lanka was created via ESRI ArcGIS Pro 2021, using seven parameters that affect the carbon sequestration potential of a particular region; soil organic carbon content, Normalized Difference Vegetation Index (NDVI), land use & land cover, mean annual rainfall distribution, land surface temperature distribution, slope, and soil pH were used in the weighted overlay analysis to get the combined influence of all parameters into one raster map layer.
Soil organic carbon content and soil pH were the parameters that were used directly in the raster format.
Maps of Normalized difference vegetation index, land slope, mean annual rainfall distribution, land use and land cover, and land surface temperature distribution were developed from the source data (Table 2.1 to Table 2.8) using ESRI ArcGIS Pro 2021.
Table 2.1: Soil property data.
| Data type | Created date | Resolution |
| Soil Organic Carbon content | 1/12/2021 | 1 km |
| Soil pH | 1/12/2021 | 1 km |
Source: (Wimalasiri et al., 2020)
Table 2.2: Rainfall data.
| Data type | No of Stations | Time period |
| Daily rainfall data | 62 | 01/01/2011 – 31/12/2020 |
Source – Department of Meteorology, Sri Lanka
Table 2.3: Digital elevation data.
| Data type | Date of update | Resolution |
| SRTM digital elevation model | 01/02/2015 | 30 m |
Source – United States Geological Survey (USGS)
Table 2.4: Atmospheric CO2 data.
| Data type | Time period | Resolution |
| OCO-3 Level 2 geo-located XCO2 retrievals results | 01/06/2023 – 10/13/2023 | 1.6 km by 2.2 km |
Source – NASA Earth data
Landsat satellite data were obtained from the United States Geological Survey: Acquired date – 20/02/2025
Table 2.5: Landsat 9 images for vegetation indices.
| Data type | Resolution |
| NIR band – Band 5 of Landsat 9 OLI/TIRS C2 L1 | 30 m |
| RED band – Band 4 of Landsat 9 OLI/TIRS C2 L1 | 30 m |
| Blue band – Band 2 of Landsat 9 OLI/TIRS C2 L1 | 30 m |
Table 2.6: Landsat 9 images for land use & land cover.
| Data type | Resolution |
| Reflective geo tiff of Landsat 9 OLI/TIRS C2 L1 | 30 m |
Table 2.7: Landsat 9 images for land surface temperature.
| Data type | Resolution |
| Thermal band – Band 10 of Landsat 9 OLI/TIRS C2 L1 On 2024/07/03, 2024/12/02, 2024/12/26 | 30 m |
Table 2.8: Soil organic carbon stock data.
| Data type | Resolution |
| Global Soil Sequestration Potential (GSOCseq) Map Current soil organic carbon stocks (in t C ha-1) in 2020 | 1 km |
Source – Food and Agriculture Organization
2.2 Project setup
The folder with parameter data files was connected to the created project. The study area shape file was created as a polygon shape file and digitized the Central Province polygon using the base map of ArcGIS Pro as the reference. For the entire project, the Sri Lanka National Grid coordinate system was used.
2.3 Parameter maps and method of preparation
2.3.1 Soil organic carbon map
The soil organic carbon raster file was inserted into the contents window of ESRI ArcGIS Pro 2021, and the cell size of the raster was changed to 30 m using the Resample tool in the Data Management tool set. The resampled soil organic carbon map was clipped into the study area shape file using the tool ‘Clip Raster’ in Data Management Tools, to create the soil organic carbon map of the Central Province.
2.3.2 Normalized Difference Vegetation Index map
The Near Infrared band raster and Red band raster files were used with this equation in the raster calculator.
NDVI = (NIR-RED) / (NIR+RED)
NIR indicates the reflectance in the near-infrared band and RED the reflectance in the red band.
2.3.3 Slope map
A digital elevation raster was used to create the slope map of the central province. The slope tool intheSurface tools of the Spatial Analysis tools was used.
2.3.4 Land use and land cover map
The supervised classification method was used with the true color composite image of Landsat 9. A signature file with training samples was created using the training sample manager in the classify tab. Six land use and land cover types were selected, including tree cover, plantation, paddy fields, bare lands, built-up areas and water bodies. The satellite image was classified into these six classes using maximum likelihood classification.
2.3.5 Rainfall distribution map
Sixty-four meteorological stations were selected, and the mean annual rainfall for each station was calculated using 10 years of daily rainfall data from 2011 to 2020. Missing rainfall data was corrected using the averages of daily data of five previous years. The total annual rainfall was calculated, and the mean values of each station were calculated.
Mean annual rainfall data was inserted as a .csv file, containing the northing & easting, and mean annual rainfall value for each selected meteorological station. The XY table-to-point tool in the Data Management tool set was used to create a point-shaped file of rainfall data with station locations. The inverse distance weight (IDW) tool in the Spatial Analysis tool set was used to create a raster map of the mean annual rainfall distribution.
2.3.6 Land surface temperature map
The Thermal Infrared Band (Band 10) of Landsat 9 raster was used in the raster calculator to convert Digital Numbers (DN) to Top-of-Atmosphere (TOA) Radiance from band 10 the radiance equation is
Lλ=ML⋅Qcal+AL
where, Lλ is TOA spectral radiance, ML is radiance multiplicative rescaling factor (from the metadata), Al is radiance additive rescaling factor (from the metadata) and, Qcal is Pixel value (Momo & Devi, 2022).
The Brightness Temperature raster was created using the TOA Radiance raster with, the brightness temperature equation is
T= K2/(ln(K1/Lλ+1))-273.15
Where, T is brightness temperature in Celsius, K1 is band-specific thermal conversion constant (from metadata), K2 is band-specific thermal conversion constant (from metadata), and Lλ is TOA radiance (Momo & Devi, 2022).
The Proportion of Vegetation (Pv) was calculated using the NDVI raster, which was created above. Using the equation in the raster calculator tool;
Pv = [(NDVI – NDVI min)/(NDVI max – NDVImin )]^2
Where NDVI min and NDVI max are the minimum and maximum NDVI values in the study area (Momo & Devi, 2022).
The Land Surface Emissivity (LSE) was calculated using the Proportion of Vegetation (Pv) raster with the equation;
(LSE) ε=0.004⋅Pv+0.986
The Land Surface Temperature (LST) raster was created using the LSE raster and brightness temperature raster (T), with the equation;
LST= T/((1+ (λ .T)/ρ)×ln(ε))
Where λ is the wavelength of emitted radiance (11.5 µm for Band 10), ρ =h⋅c/σ: A constant value (14388 µm K), ε is land surface emissivity and T is brightness temperature (Celsius) (Momo & Devi, 2022).
2.3.7 Soil pH map
The soil pH raster file was resampled into a 30 m resolution raster map and clipped into the study area shape file using the tool ‘Clip Raster’ in Data Management Toolset to create the soil pH map of the Central Province.
2.4 Resampling and boundary clipping
All developed maps for individual parameters were resampled into raster maps with 30 m resolution. The study area of Central Province was extracted from all resampled raster maps using clipping tools.
2.5 Reclassification of individual maps
All individual map layers were reclassified into five classes according indicating the impact of each parameter on carbon sequestration (Table 3.9 to Table 3.15). Reclassification levels of soil organic carbon content, normalized difference vegetation index, land use and land cover, land surface temperature, soil pH, land slope, and mean annual rainfall were selected according to literature (Akpa et al., 2016; Legesse et al., 2024; Li et al., 2022; Momo & Devi, 2022; Islam et al., 2014; Yohannes & Soromessa, 2015; Ahukaemere et al., 2019; Rohr et al., 2013).
Table 2.9: Soil organic carbon contents and classified carbon sequestration categories
| SOC range (%) | Carbon sequestration category |
| < 1.50 | Very low |
| 1.50 – 2.00 | Low |
| 2.00 – 2.50 | Moderate |
| 2.50 – 3.00 | High |
| 3.00 – 3.50 | Very high |
Source: Akpa et al., 2016
Table2.10: Normalized difference vegetation index ranges and classified carbon sequestration categories
| NDVI Range | Carbon sequestration category |
| -0.20 – -0.04 | Very low |
| -0.04 – 0.12 | Low |
| 0.12 – 0.28 | Moderate |
| 0.28 – 0.44 | High |
| 0.44 – 0.60 | Very high |
Source: Legesse et al. (2024)
Table 2.11: Land use and land cover types and classified carbon sequestration categories
| LULC Type | Carbon sequestration category |
| Water bodies | Very low |
| Built-up areas | Low |
| Bare land | Moderate |
| Paddy fields | Moderate |
| Plantations | High |
| Tree cover | Very high |
Source: Li et al., 2022
Table 2.12: Land surface temperature levels and classified carbon sequestration categories
| LST Range (°C) | Carbon sequestration category |
| 8.00 -12.00 | Very high |
| 12.00 -16.00 | High |
| 16.00 -20.00 | Moderate |
| 20.00 – 24.00 | Low |
| 24.00 – 28.00 | Very low |
Source: Momo and Devi, 2022
Table 2.13: Soil pH ranges and classified carbon sequestration categories
| pH range | Carbon sequestration category |
| 5.00 – 5.20 | Very high |
| 5.20 – 5.40 | High |
| 5.40 – 5.60 | Moderate |
| 5.60 – 5.80 | Low |
| 5.80 – 6.00 | Very low |
Source: Islam et al., 2014
Table 2.14: Slope distribution levels and classified carbon sequestration categories
| Average Slope (Degree) | Average Slope (%) | Carbon sequestration category |
| < 6 | 0 -10 | Very high |
| 6.0 – 13.0 | 10 – 24 | High |
| 13.0 – 27.0 | 24 – 50 | Moderate |
| 27.0 – 45.0 | 50 – 100 | Low |
| 45.0 < | 100 – 810 | Very low |
Sources: Yohannes & Soromessa (2015) ; Ahukaemere et al. (2019)
Table 2.15: Mean annual rainfall and classified carbon sequestration categories
| Mean annual rainfall (mm) | Carbon sequestration category |
| 1300 -1700 | Very high |
| 1700 – 2000 | High |
| 2000 – 3000 | Moderate |
| 3000 – 4000 | Low |
| 4000 < | Very low |
Source: Rohr et al., 2013
2.6 3.6 Calculation of weights determining the influence of individual parameter
Multi-criteria decision-making method through the Analytical Hierarchy Process was used to calculate weights of each parameter that is used to perform overlay analysis as given in Table 3.16.
Table 2.16: Relative importance of each parameter; Pair wise comparison matrix of AHP
| SOC | CVI | LULC | LST | pH | Slope | Rainfall | |
| SOC | 1.00 | 2.00 | 3.00 | 5.00 | 5.00 | 9.00 | 9.00 |
| NDVI | 0.50 | 1.00 | 2.00 | 4.00 | 4.00 | 8.00 | 8.00 |
| LULC | 0.33 | 0.50 | 1.00 | 3.00 | 3.00 | 7.00 | 7.00 |
| LST | 0.20 | 0.25 | 0.33 | 1.00 | 2.00 | 5.00 | 5.00 |
| pH | 0.20 | 0.25 | 0.33 | 0.50 | 1.00 | 5.00 | 5.00 |
| Slope | 0.11 | 0.13 | 0.14 | 0.20 | 0.20 | 1.00 | 2.00 |
| Rainfall | 0.11 | 0.13 | 0.14 | 0.20 | 0.20 | 0.50 | 1.00 |
Note: SOC – Soil Organic Carbon, NDVI – Normalized Difference Vegetation Index, LULC – Land Use and Land Cover, LST – Land Surface Temperature, pH – Soil pH, Slope – Land Slope, Rainfall – Mean annual rainfall
By considering the relative importance on carbon sequestration, according to the literature, the correlation coefficient of each parameter vs carbon stock was considered to assign cell values of the AHP matrix (Table 3.17).
Table 2.17: Correlation coefficients of individual parameter with soil carbon stock, and relevant sources
| Parameter | R2 | R | Source |
| SOC | 0.9200 | 0.9592 | Sá and Lal (2009) |
| NDVI | 0.8167 | 0.9037 | Samphutthanont et al. (2024) |
| LULC | 0.6700 | 0.8185 | Alidoust et al. (2018) |
| LST | 0.4000 | 0.6325 | Jones et al. (2006) |
| pH | 0.3600 | 0.6000 | Islam et al. (2014) |
| Slope | 0.0666 | 0.2580 | Yohannes & Soromessa (2015) |
| Rainfall | 0.0660 | 0.2569 | Wang (2020) |
Note: SOC – Soil Organic Carbon, NDVI – Normalized Difference Vegetation Index, LULC – Land Use and Land Cover, LST – Land Surface Temperature, pH – Soil pH, Slope – Land Slope, Rainfall – Mean annual rainfall
The cell value was assigned, considering the relative importance of each parameter,
according to Table 3.18.
Table 2.18: Cell values to demarcate the relative importance of each parameter
| Cell Value | Verbal Judgment of Preference |
| 1 | Equal importance |
| 3 | Moderate importance of one over the other |
| 5 | Strong importance of one over the other |
| 7 | Very strong importance of one over the other |
| 9 | The extreme importance of one over the other |
| 2, 4, 6, 8 | Intermediate values represent a compromise between preferences |
| Reciprocals (1/x) | If parameter A is less important than B, assign the reciprocal (e.g., 1/3 if B is moderately more important than A) |
Source: Mustafa et al., 2011
2.7 Weighted overlay analysis
The weighted overlay tool was used to overlay all reclassified maps for individual parameters. The influence values were assigned to each parameter as percentages, calculated using AHP. The 1 to 5 scale was used to give the importance value for each class in each parameter according to the order given in Table 3.19.
Table 2.19: Scale values for each carbon sequestration potential level
| Scale value | Carbon sequestration level |
| 1 | Very low |
| 2 | Low |
| 3 | Moderate |
| 4 | High |
| 5 | Very high |
2.8 Validation
The Global Soil Sequestration Potential (GSOCseq) map acquired from the Food and Agriculture Organization (FAO) was used to validate the developed carbon sequestration potential map of the central province. The band collection statistics tool was used to get the correlation coefficient between two raster maps.
The atmospheric carbon dioxide data was used to create the raster map of atmospheric CO2 concentration in ppm, using the XY table to point tool and IDW tool. The band collection statistics tool was used to get the correlation coefficient between the developed carbon sequestration potential map and the atmospheric CO2 concentration raster map.
3 RESULTS AND DISCUSSION
Study area
The Central Province of Sri Lanka was selected as the study area for the project, and the digitized extent of the study area is 5730 km2 (Figure 3.1). The study area consists of Kandy, Mathale and Nuwara Eliya districts and a higher spatial variation of several parameters are obvious including soil organic carbon content, vegetation distribution, and land use & land cover in these districts.

Figure 3.1: The study area; The central province of Sri Lanka
Table 3.1: Calculated weights for overlay of all parameter maps using the analytical hierarchy process (AHP)
| Parameter | Percentage (%) |
| Soil organic carbon content (SOC) | 36 |
| Normalized Difference Vegetation Index (NDVI) | 24 |
| Land use and land cover (LULC) | 17 |
| Land surface temperature (LST) | 10 |
| Soil pH | 8 |
| Land slope | 3 |
| Mean annual rainfall | 2 |
The developed matrix of the analytical hierarchy process (AHP) was confirmed as consistent, since the obtained consistency ratio was 0.0483, which is less than 0.1.
Maps of contributing factors for carbon sequestration of the Central Province of Sri Lanka
According to the calculated weights, the most dominant factor is soil organic carbon content (Table 3.1), which demonstrated a strong positive relationship with carbon sequestration potential. Also, Sá & Lal (2009) identified a strong positive relationship between soil organic carbon content and the carbon sequestration potential of an area. Therefore, Nuwara Eliya, which exhibited the highest SOC level (Figure 3.2) is the zone within the study area with the highest carbon sequestration potential, whereas Matale and Kandy districts, which had the lowest SOC distribution to a great extent (Figure 3.2), should be the zone with the lowest carbon sequestration potential.

Figure 3.2: Soil organic carbon distribution map of the Central Province
The influence of soil pH was 8.0 % on the carbon sequestration potential according to the AHP calculation (Table 3.1) and exhibited a negative relationship with the carbon stock level of the soil (Table 2.17). According to Islam et al. (2014), a negative relationship was identified between soil pH and carbon sequestration potential. In the study area, the soil pH ranged from 5.00 to 6.00 (Figure 3.3), indicating an overall slightly acidic soil distribution. This pH range can be considered more favorable for carbon sequestration potential than an alkaline soil.

Figure 3.3: Soil pH distribution map of the Central Province
NDVI had a strong positive relationship with soil carbon stock, according to Table 2.17, and it was the second dominant factor that affects carbon sequestration potential evaluation according to AHP (Table 3.1). Higher NDVI values (0.44 – 0.60) represent areas of higher vegetation density, and the lowest NDVI values (-0.20 – 0.12) represent water bodies and urbanized areas (Figure 3.4). Areas of high and medium density vegetation had higher carbon stock compared to low-density vegetation and urbanized areas (Legesse et al., 2024).

Figure 3.4: Normalized difference vegetation index map of the Central Province
According to Li et al. (2022), land with tree cover and plantations had the highest carbon stocking ability, and the urban areas with high land degradation and disturbance had the lowest carbon stocking ability. Land use types such as tree cover, plantations, paddy fields, bare lands, developed areas, and water bodies had different levels of impact on carbon stock in each region. The level of carbon stock in each land use type decreased as per the ordered sequence given in Table 2.11. A correlation (R2) of 0.67 resulted between the carbon stocking ability and the land use & land cover spatial distribution (Table 2.17)

Figure 3.6: Land use and land cover map of the Central Province
Table 3.2: Percentages of land use and land cover types obtained from supervised classification
| Type | Pixel count | Percentage (%) |
| Plantations | 20885164 | 36.44 |
| Tree cover | 22941968 | 40.03 |
| Bare lands | 2210407 | 3.86 |
| Water | 964719 | 1.68 |
| Built-up | 3871257 | 6.75 |
| Paddy | 6440005 | 11.24 |
| Total | 57313520 | 100.00 |
According to Jones et al. (2006); Momo & Devi (2022) the land surface temperature (LST) negatively impacts on carbon stock in the soil. Since the increase of LST increases the microbial respiration rate leading to a reduction in soil carbon sequestration potential. A large extent of Nuwara Eliya district and the Knuckles mountain range area had the lowest LST levels (Figure 3.6) facilitating carbon sequestration in the respective areas. Wasgamuwa National Park and and Dambulla had the highest LST levels (Figure 3.6), indicating relatively low carbon sequestration potential.

Figure 3.6: Land surface temperature distribution map of the Central Province
Yohannes & Soramessa (2015) observed a negative relationship between slope and soil carbon stock. The slope degree from 0.00 to 6.00 represents the relatively flat areas, which are located in lower elevations and less exposed to soil erosion conditions. The accumulation of eroded topsoil was higher in flat or low slope areas leading to high soil organic matter content. Water bodies are found to be located in the lower slopes (Figure 3.7). Summit areas have a slope degree from 6.00 to 13.00, where comparatively low soil erosion occurred, but the accumulation of soil organic matter was less than the lower slopes. Beyond the 13.00 slope, the topsoil loss was found to have increased, reducing the soil carbon stock (Yohannes & Soromessa, 2015; Ahukaemere et al., 2019).

Figure 3.7: Slope distribution map of the Central Province
According to AHP, mean annual rainfall distribution was the least important factor, which impacts on soil carbon stock (Table 3.1), since it had the minimum correlation with soil carbon stock (Table 2.17). Under heavy rainfall events (>1700 mm) (Figure 3.8), soil erosion increases, directing to a reduction in soil carbon stock (Rohr et al., 2013). The Central Province has a high mean annual rainfall, negatively impacting soil carbon sequestration.

Figure 3.8: The mean annual rainfall distribution map of the Central Province
The outcomes of this study provided insights into the spatial distribution of carbon sequestration potential (CSP) indicating distinct spatial patterns across the Central Province of Sri Lanka. Relatively a higher carbon sequestration potential was identified in Horton Plains and the forest reserves in the Nuwara Eliya district, which are considered less-disturbed ecosystems. The lower carbon sequestration regions were identified in the urbanized and agricultural areas in Kandy, Matale, and Dambulla. (Figure 3.9). The hotspot analysis aided in identifying the significant sequestration hotspot zones and the cold spot zones (Figure 3.10).
The carbon sequestration potential (CSP) map displayed distinct spatial patterns of carbon sequestration across the central province. Areas with 2.5 – 3.5 % soil organic carbon content (Figure 3.2) showed a strong positive relationship with carbon sequestration potential, making those regions significant sequestration hotspot zones (Figure 3.10).
The significant sequestration hotspot zones carried the highest vegetation index values (0.44 – 0.60) (Figure 3.4), reflecting healthy and dense tree cover and plantations with higher carbon stock as biomass. Moreover, 8 – 20 0C (Figure 3.6) low land surface temperature distribution with moderate to low respiration rate was observed. The soil pH distribution varied within the range of 5.0 – 5.4 with slightly acidic conditions facilitating carbon stock in soil (Figure 3.3). Mean annual rainfall was >2000 mm (Figure 3.8) and land slope distribution was >130 (Figure 3.7), representing higher soil erosion conditions which reduce the carbon stock in soil, but the impacts of these two were found to be the least by the AHP analysis (Table 3.1) compared with other parameters that affect carbon stock.
The lowest carbon sequestration potential areas (Figure 3.9) and significant sequestration cold spot zones were found mainly aligned with built-up areas and water bodies (Figure 3.10) with <1.5% low soil organic carbon content (Figure 3.2). Vegetation index values (-0.2 to 0.12) (Figure 3.4) were relatively very low, indicating the least carbon stocking ability in the study area. The highest land surface temperature range (20 – 29 C0) (Figure 3.6) with higher microbial respiration rates were present in these regions. The soil pH range fall within 5.6 – 6.0 range (Figure 3.3) showing a moderate carbon stock ability where the land slope distribution varied within the range of 0 – 130 (Figure 3.7). The mean annual rainfall ranged from 1300 – 2000 mm (Figure 3.8), indicating a moderate carbon sequestration ability.
Areas with moderate carbon sequestration potential (Figure 3.9) and non-significant sequestration zones (Figure 3.10), mainly located in the Northeast and Northwest regions of the Central Province with a low soil organic carbon content (1.5 – 2.0%) (Figure 3.2), vegetation cover with moderate dense vegetation (0.28 – 0.44) (Figure 3.4). The land use mainly composed of paddy and plantations (Figure 3.5), where moderate carbon stocking ability was present due to land degradation and less vegetation. The land surface temperature fluctuated from 200 – 240 C(Figure 3.6), and the soil pH was from 5.2 to 5.8 (Figure 3.3); relatively a higher pH level that reduces the carbon stocking ability of soil. The land slope (60 -270) (Figure 3.7) and mean annual rainfall (1700 – 2000 mm) (Figure 3.8) were within a favorable range for high carbon stocking ability. Due to the moderate impact of the dominant parameters that impact the carbon sequestration (SOC, NDVI, and LULC), the carbon sequestration potential became moderate ultimately.

Figure 3.9: Carbon sequestration potential map of the Central Province

Figure 3.10: Map showing the distribution of carbon sequestration hotspots and cold spots of the Central Province
Map Comparison
The correlation (R2 value) between the developed carbon sequestration potential map (Figure 10) and the soil organic carbon sequestration map of Food and Agriculture Organization (FAO) (Figure 12) was 0.76185, which represented a strong relationship between them.

Figure 3.11: Soil organic carbon sequestration map of the Central Province developed by Food and Agriculture Organization
The correlation between the developed carbon sequestration potential (CSP) map (Figure 10) and the atmospheric CO2 concentration map (Figure 13) equals -0.10562 (R2). This weak negative correlation reflects that there is no a strong relationship between them.
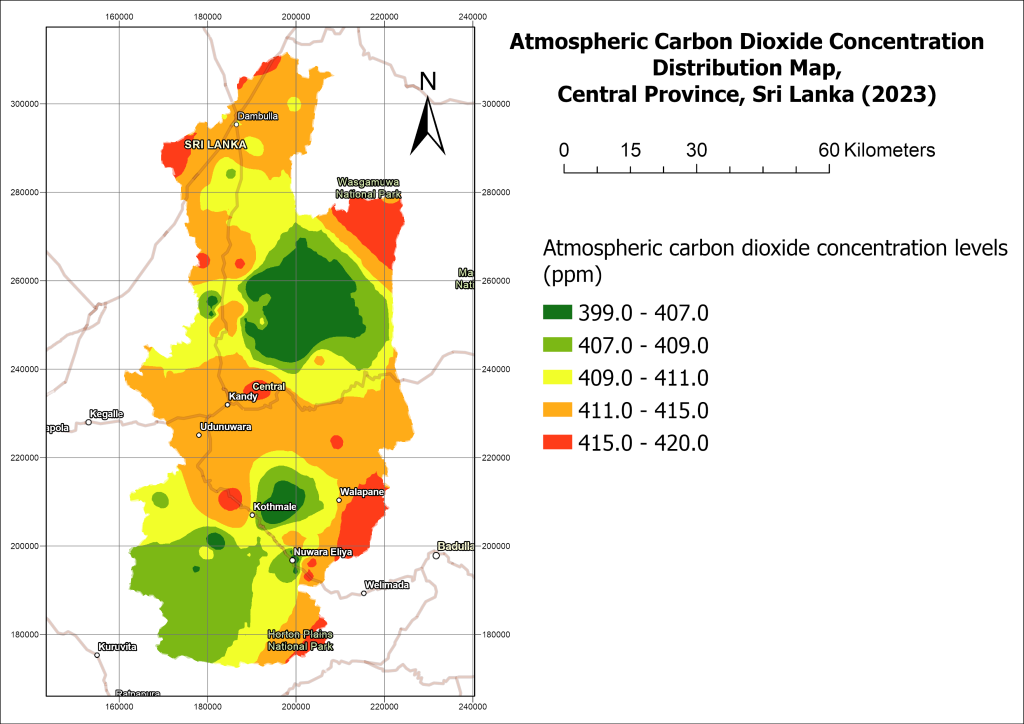
Figure 3.12: Atmospheric carbon dioxide concentration map of the Central Province
4 Conclusion and Recommendations
4.1 Conclusions
The evaluation of the project on mapping carbon sequestration hotspots of the Central Province of Sri Lanka, using geographical information systems (GIS) and remote sensing technology, indicated that the overlaying in GIS is an accurate method for assessing carbon sequestration potential in tropical regions. The combined use of GIS and remote sensing techniques provided an efficient approach to developing the spatial distribution of carbon sequestration potential. The importance and the impact of factors such as soil organic carbon content, normalized difference vegetation index (NDVI), land use & land cover, mean annual rainfall distribution, land surface temperature distribution, slope, and soil pH on carbon sequestration potential were identified. Soil organic carbon content had the highest impact on carbon sequestration potential whereas the mean annual rainfall had the lowest impact.
The resulting potential and hotspot maps provide a precise identification of areas with conservation and restoration requirements, which can be used to align with several SDGs (12,13, and 15) that facilitate climate change mitigation, biodiversity conservation, and food security.
4.2 Recommendations
SDG 13 (Climate Action), SDG 15 (Life on Land), and SDG 12 (Responsible Consumption and Production) are some of the several United Nations Sustainable Development Goals (SDGs), that are directly related to the results of the project.
In climate change mitigation, carbon sequestration plays a vital role by reducing atmospheric carbon dioxide (CO₂) levels, which aligns with SDG 13 (Climate action) (Arora & Mishra, 2023). SDG 15 (Life on Land) aligns with the protection and sustainable management of terrestrial ecosystems, which focuses on the conservation of biodiversity (Arana et al., 2020). This study identified the regions with significant sequestration hotspots (Figure 3.10), which should be protected from deforestation, land degradation, and encroachments to sustain their role as carbon sinks and sequestration cold spots that should be reforested to meet the required sequestration potentials. Areas classified as significant sequestration cold spot zones can be prioritized for ecosystem restoration programs to improve overall ecosystem resilience, which can include revegetation, afforestation (Gorman et al., 2022), and soil conservation initiatives. In order to achieve SDG 12 (Responsible Consumption and Production), sustainable land-use practices are required, which emphasize efficient and responsible natural resources management (Schröder et al., 2023). Regions with high human activity, industrial expansion, and intensive agriculture often correspond to significant carbon sequestration cold spots.
Organic farming (Leifeld & Fuhrer, 2010), conserved tillage agriculture (Lal & Kimble, 1997), and integrated soil fertility management can be used to increase soil organic carbon levels while maintaining agricultural productivity. Green infrastructure and urban forestry (Vasiljević et al., 2018) are integrated with Sustainable urban planning to enhance carbon sequestration potential within cities and urban areas.
5 REFERENCES
Abdullahi, A.C., Siwar, C., Shaharudin, M.I.I. and Anizan, I., 2018. Carbon sequestration in soils: the opportunities and challenges. Carbon capture, utilization and sequestration, 1, pp.3-16.
Abeysekara, A.M.S.K., Yatigammana, S.K. and Premakantha, K.T., 2018. Biomass and carbon stock estimation of Udawattakele forest reserve in Kandy district of Sri Lanka.
Ahukaemere, CM., Irokwe, I.F., Onwudike, S.U., Agim, L.C. and Aririguzo, B.N., 2019. Topography and Depth Influences on Soil Nitrogen and Carbon Sequestration.
Akpa, S.I., Odeh, I.O., Bishop, T.F., Hartemink, A.E. and Amapu, I.Y., 2016. Total soil organic carbon and carbon sequestration potential in Nigeria. Geoderma, 271, pp.202-215.
Alidoust, E., Afyuni, M., Hajabbasi, M.A. and Mosaddeghi, M.R., 2018. Soil carbon sequestration potential as affected by soil physical and climatic factors under different land uses in a semiarid region. Catena, 171, pp.62-71.
Arana, C., Franco, I.B., Joshi, A. and Sedhai, J., 2020. SDG 15 life on land: A review of sustainable fashion design processes: Upcycling waste organic yarns. Actioning the global goals for local impact: Towards sustainability science, policy, education and practice, pp.247-264.
Arora, N.K. and Mishra, I., 2023. Sustainable development goal 13: recent progress and challenges to climate action. Environmental Sustainability, 6(3), pp.297-301.
Dananjaya, K.A.J., 2017. Climate change impacts on biodiversity and ecosystems in Sri Lanka: a review. Nature Conservation Research. Заповедная наука, 2(3), pp.2-22.
de Moraes Sa, J.C. and Lal, R., 2009. Stratification ratio of soil organic matter pools as an indicator of carbon sequestration in a tillage chronosequence on a Brazilian Oxisol. Soil and Tillage Research, 103(1), pp.46-56.
Don, A., Seidel, F., Leifeld, J., Kätterer, T., Martin, M., Pellerin, S., Emde, D., Seitz, D. and Chenu, C., 2024. Carbon sequestration in soils and climate change mitigation—Definitions and pitfalls. Global Change Biology, 30(1), p.e16983.
Dossa, K.F. and Miassi, Y.E., 2024. Remote Sensing Methods and GIS Approaches for Carbon Sequestration Measurement: A General Review. Int. J. Environ. Clim. Chang, 14, pp.222-233.
Droj, G., 2012. GIS and remote sensing in environmental management. J Environ Prot Ecol, 13(1), p.361.
Food and Agriculture Organization soils portal (https://www.fao.org/soils-portal/data-hub/soil-maps-and-databases/global-soil-organic-carbon-sequestration-potential-map-gsocseq/en/)
Gorman, D., Jayakody, S., Kodikara, S., Udagedara, S., Dahanayaka, D.D.G.L., Ranawana, K.B., Kumara, M.P., Pahalawattaarachchi, V., Thavanayagam, M., Steven, A.D. and Gunawardana, J.A., 2022. Past, present and future of Sri Lankan coastal macrophyte-dominated ecosystems: blue carbon, conservation, restoration and policy. In Oceanography and Marine Biology (pp. 301-334). CRC Press.
Islam, K.K., Anusontpornperm, S., Kheoruenromne, I. and Thanachit, S., 2014. Relationship between carbon sequestration and physico-chemical properties of soils in salt-affected areas, Northeast Thailand. Agriculture and Natural Resources, 48(4), pp.560-576.
Jat, M.L., Chakraborty, D., Ladha, J.K., Parihar, C.M., Datta, A., Mandal, B., Nayak, H.S., Maity, P., Rana, D.S., Chaudhari, S.K. and Gerard, B., 2022. Carbon sequestration potential, challenges, and strategies towards climate action in smallholder agricultural systems of South Asia. Crop and Environment, 1(1), pp.86-101.
Jones, S.K., Rees, R.M., Kosmas, D., Ball, B.C. and Skiba, U.M., 2006. Carbon sequestration in a temperate grassland; management and climatic controls. Soil Use and Management, 22(2), pp.132-142
.
Khosravi, M.A., Heshmati, G.A. and Salman, M.A.R., 2015. Identifying carbon sequestration hotspots in semiarid rangelands (Case study: Baghbazm region of Bardsir city, Kerman province).
Lal, R. and Kimble, J.M., 1997. Conservation tillage for carbon sequestration. Nutrient cycling in agroecosystems, 49, pp.243-253.
Legesse, F., Degefa, S. and Soromessa, T., 2024. Estimating carbon stock using vegetation indices and empirical data in the upper awash river basin. Discover Environment, 2(1), pp.1-17.
Leifeld, J. and Fuhrer, J., 2010. Organic farming and soil carbon sequestration: what do we really know about the benefits?. Ambio, 39(8), pp.585-599.
Li, Y., Liu, W., Feng, Q., Zhu, M., Yang, L. and Zhang, J., 2022. Effects of land use and land cover change on soil organic carbon storage in the Hexi regions, Northwest China. Journal of Environmental Management, 312, p.114911.
Momo, N. and Devi, T.T., 2022. Assessment of land surface temperature and carbon sequestration using remotely sensed satellite data in the Imphal-West district, Manipur, India. Journal of Earth System Science, 131(4), p.229.
Mustafa, A.A., Singh, M., Sahoo, R.N., Ahmed, N., Khanna, M., Sarangi, A. and Mishra, A.K., 2011. Land suitability analysis for different crops: a multi criteria decision making approach using remote sensing and GIS. Researcher, 3(12), pp.61-84.
NASA Earth data (https://search.earthdata.nasa.gov/search)
Nowreen, S., Newton, I.H., Zzaman, R.U., Islam, A.S., Islam, G.T. and Alam, M.S., 2021. Development of potential map for groundwater abstraction in the northwest region of Bangladesh using RS-GIS-based weighted overlay analysis and water-table-fluctuation technique. Environmental Monitoring and Assessment, 193, pp.1-17.
Ramachandra, T.V. and Bharath, S., 2020. Carbon sequestration potential of the forest ecosystems in the Western Ghats, a global biodiversity hotspot. Natural Resources Research, 29(4), pp.2753-2771.
Ramasubramanian, B. and Ramakrishna, S., 2023. What’s next for the Sustainable Development Goals? Synergy and trade-offs in affordable and clean energy (SDG 7). Sustainable earth reviews, 6(1), p.17.
Rathnayake, C.W., Jones, S. and Soto-Berelov, M., 2020. Mapping land cover change over a 25-year period (1993–2018) in Sri Lanka using Landsat time-series. Land, 9(1), p.27.
Rohr, T., Manzoni, S., Feng, X., Menezes, R.S. and Porporato, A., 2013. Effect of rainfall seasonality on carbon storage in tropical dry ecosystems. Journal of Geophysical Research: Biogeosciences, 118(3), pp.1156-1167.
Samphutthanont, R., Suppawimut, W., Kitthitinan, P. and Promsopha, K., 2024. Carbon Sequestration Assessment Using Satellite Data and GIS at Chiang Mai Rajabhat University: 10.32526/ennrj/22/20240183. Environment and Natural Resources Journal, 22(6), pp.574-584.
Sarathchandra, C., Abebe, Y.A., Wijerathne, I.L., Aluthwattha, S.T., Wickramasinghe, S. and Ouyang, Z., 2021. An overview of ecosystem service studies in a tropical biodiversity hotspot, Sri Lanka: Key perspectives for future research. Forests, 12(5), p.540.
Schröder, P., Antonarakis, A.S., Brauer, J., Conteh, A., Kohsaka, R., Uchiyama, Y. and Pacheco, P., 2019. SDG 12: responsible consumption and production–Potential Benefits and impacts on forests and livelihoods. Sustainable development goals: their impacts on forests and people, pp.386-418.
Sierra, C.A., Crow, S.E., Heimann, M., Metzler, H. and Schulze, E.D., 2021. The climate benefit of carbon sequestration. Biogeosciences, 18(3), pp.1029-1048.
United States Geological Survey (https://earthexplorer.usgs.gov/)
Vasiljević, N., Radić, B., Gavrilović, S., Šljukić, B., Medarević, M. and Ristić, R., 2018. The concept of green infrastructure and urban landscape planning: A challenge for urban forestry planning in Belgrade, Serbia. IForest-Biogeosciences and Forestry, 11(4), p.491.
Wang, S. and Huang, Y., 2020. Determinants of soil organic carbon sequestration and its contribution to ecosystem carbon sinks of planted forests. Global change biology, 26(5), pp.3163-3173.
Wimalasiri, Eranga M.; Jahanshiri, Ebrahim; Suhairi, T.A.S.T.M.; Mapa, Ranjith B. (2020), “Nation-wide open soil property maps of up to 100 cm depth for Sri Lanka”, Mendeley Data, V1, doi: 10.17632/5sc7njfcyn.1
Yohannes, H., Soromessa, T. and Argaw, M., 2015. Carbon stock analysis along slope and slope aspect gradient in Gedo Forest: implications for climate change mitigation. J Earth Sci Clim Change, 6(09), pp.6-11.
Very good https://is.gd/N1ikS2